


Hard skills include expertise in data visualization, SQL querying, and dashboard creation, which are essential for Tableau developer analysts to transform data into actionable insights.
Tableau Developer Analyst Resume Examples & Templates
Looking to stand out as a Tableau Developer Analyst? Our Tableau Developer Analyst resume examples showcase data visualization expertise and analytical skills that will catch employers' attention.

by Gabriela Hernandez, Last Updated: January 18, 2026
Hired By:*

- Popular Tableau Developer Analyst Resume Examples
- Resume Template—Easy to Copy & Paste
- Build Your Resume in Minutes
- How to Write a Tableau Developer Analyst Resume Summary
- Showcasing Your Work Experience
- Top Skills to Include on Your Resume
- Resume Format Examples
- Related Computer Software Resume Examples
- Frequently Asked Questions
- Should I include a cover letter with my Tableau developer analyst resume?
- Can I use a resume if I’m applying internationally, or do I need a CV?
- What soft skills are important for Tableau developer analysts?
- I’m transitioning from another field. How should I highlight my experience?
- How do I write a resume with no experience?
- How do I add my resume to LinkedIn?
Popular Tableau Developer Analyst Resume Examples
Check out our top Tableau developer analyst resume examples that showcase critical skills like data visualization, analytical thinking, and business intelligence expertise. These examples will help you effectively highlight your accomplishments to attract potential employers.
Ready to build a standout resume? Our Resume Builder offers user-friendly templates designed specifically for data professionals, making it simple to present your skills and experience.
Recommended
 Customize This Resume
Entry-level Tableau developer analyst resume
What this resume does well:
This entry-level resume for a Tableau Developer Analyst effectively highlights the job seeker's technical skills and compelling contributions to data visualization projects, demonstrating a strong foundation in business intelligence. New professionals in this field must showcase their ability to improve data processing efficiency and client satisfaction through innovative solutions, even with limited work experience.
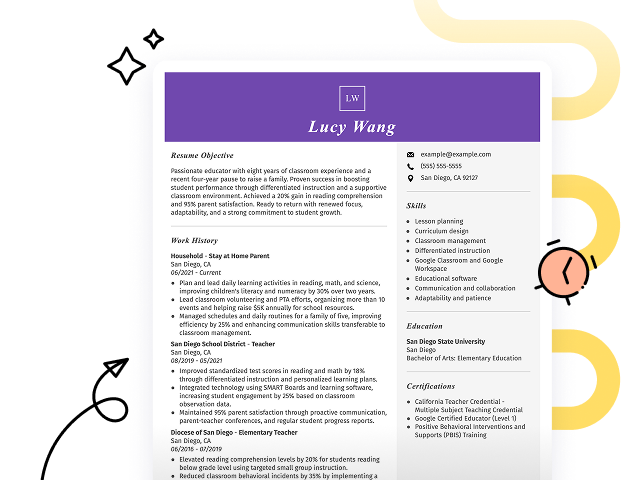
Mid-career Tableau developer analyst resume
What this resume does well:
This resume effectively outlines the applicant’s extensive experience in data analytics and Tableau, showcasing their ability to drive efficiency and mentor others. Highlighting measurable achievements demonstrates readiness for advanced roles and complex challenges in business intelligence.
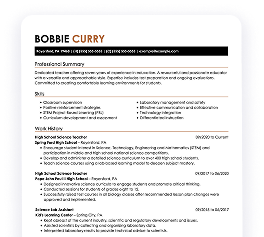
Experienced Tableau developer analyst resume
What this resume does well:
The work history highlights the applicant's ability to improve data processes, such as increasing dashboard efficiency by 30%. Bullet points clearly emphasize achievements like optimizing data extraction and improving client satisfaction. This structured format suits applicants with extensive technical accomplishments.
Resume Template—Easy to Copy & Paste
Example
Allison Cruz
Austin, TX 78703
(555)555-5555
Allison.Cruz@example.com
Professional Summary
Skilled Tableau Developer Analyst with expertise in data analysis, dashboard development, and business intelligence. Proven track record in optimizing visualizations, enhancing efficiency by over 30%.
Work History
Tableau Developer Analyst
DataWave Solutions - Austin, TX
June 2023 - December 2025
- Increased report efficiency by 30% using optimization
- Developed 15+ interactive dashboards monthly
- Collaborated with 5 teams to refine data visuals
BI Engineer
Insight Analytics Corp - Pinehill, TX
June 2019 - May 2023
- Reduced data processing time by 40% with new pipeline
- Created over 50 dynamic visualizations annually
- Trained 20+ team members on Tableau techniques
Data Visualization Specialist
VizTech Solutions - Houston, TX
January 2017 - May 2019
- Enhanced dashboard load speed by 25%
- Developed 100+ user-friendly reports in two years
- Collaborated with IT for seamless data integration
Skills
- Tableau
- SQL
- Data Analysis
- Dashboard Development
- Data Visualization
- Business Intelligence
- Python
- ETL Processes
Certifications
- Tableau Certified Data Analyst - Tableau
- Certified Business Intelligence Professional - CBIP Institute
Education
Master of Science Data Science
Stanford University Stanford, California
June 2016
Bachelor of Science Computer Science
University of California, Berkeley Berkeley, California
June 2015
Languages
- Spanish - Beginner (A1)
- French - Beginner (A1)
- Mandarin - Beginner (A1)
Build Your Resume in Minutes
Creating a custom resume is easier than ever with our Resume Builder!
How to Write a Tableau Developer Analyst Resume Summary
Your resume summary is the first impression employers will have of you, making it important to capture their attention immediately. As a Tableau developer analyst, you should highlight your analytical skills and experience with data visualization to demonstrate your value. The following examples will illustrate effective approaches to crafting a compelling summary, helping you understand what resonates with hiring managers:
Weak Example
I am a dedicated Tableau developer analyst with some experience in data visualization and analysis. I hope to find a position where I can use my skills to contribute positively to the company. A role that offers flexibility and growth would be great for me, as I believe I can add value if given the chance.
Why this summary misses the mark:
- Lacks specific examples of technical skills or achievements in Tableau development
- Overemphasizes personal desires rather than detailing how the applicant can meet employer needs
- Employs vague language that does not convey confidence or expertise in the field
Strong Example
Detail-oriented Tableau Developer Analyst with over 4 years of experience in data visualization and analytics. Successfully improved report generation efficiency by 30% through the implementation of automated dashboards, resulting in faster decision-making processes for stakeholders. Proficient in SQL, data modeling, and creating interactive visualizations that drive business insights.
Why this summary works:
- Begins with specific experience level and area of expertise
- Highlights quantifiable achievement showcasing a significant impact on operational efficiency
- Mentions relevant technical skills essential for a Tableau Developer Analyst role
Pro Tip
If you don’t have much formal experience, consider crafting a career objective. This approach can highlight your enthusiasm and skills more effectively than a summary. Explore resume objective examples specific to Tableau development to inspire your own unique statement.
Showcasing Your Work Experience
The work experience section is important on your resume as a Tableau developer analyst, serving as the primary focus of your content. Good resume templates always emphasize this section to ensure you highlight your relevant experience effectively.
This area should be organized in reverse-chronological order, detailing each position you've held. Use bullet points to showcase key achievements and projects that demonstrate your skills in data visualization and analysis.
To help illustrate effective practices, we will present a couple of examples that reveal what works well in this section and what pitfalls to avoid.
Weak Example
Tableau Developer Analyst
Tech Solutions Inc. – Austin, TX
- Created reports using Tableau
- Worked with data and made visualizations
- Collaborated with team members on projects
- Assisted in troubleshooting issues
Why this work experience section misses the mark:
- Lacks specific employment dates for context
- Bullet points do not highlight any measurable achievements or impacts
- Describes basic responsibilities instead of showcasing unique skills or contributions
Strong Example
Tableau Developer Analyst
Data Insights Corp – San Francisco, CA
March 2020 - Present
- Develop interactive dashboards in Tableau that improved data visibility for stakeholders, leading to a 30% increase in decision-making speed
- Automate reporting processes, reducing manual workload by 40 hours per month and improving accuracy of data analysis
- Collaborate with cross-functional teams to gather requirements and deliver insights that contributed to a 15% rise in sales performance
Why this work experience section works:
- Starts each bullet point with powerful action verbs that highlight the applicant’s contributions
- Incorporates quantitative metrics to demonstrate the impact of the job seeker’s work on business outcomes
- Showcases relevant technical skills and teamwork capabilities important for the role
While your resume summary and work experience are important, don't overlook the significance of other sections. Each part contributes to a complete picture of your skills. For expert guidance, explore our detailed guide on how to write a resume.
Top Skills to Include on Your Resume
A skills section is important for any resume as it provides a snapshot of your core competencies, making it easier for employers to see how well you align with the job. This section serves as a bridge between job requirements and your qualifications.
Hiring managers rely on the skills section to quickly determine job seeker suitability before reviewing detailed experience. For Tableau Developer Analysts, it's vital to highlight both technical and interpersonal skills, which will be elaborated below.
Including soft skills in the role of a Tableau developer analyst is important, as they improve teamwork, communication, and problem-solving abilities. This leads to more effective data-driven insights and collaboration with stakeholders.
When selecting skills for your resume, it's essential to align with what employers expect from an ideal job seeker. Many organizations use automated systems to filter out applicants who lack the necessary resume skills for the position.
To improve your chances of being noticed, carefully review job postings. They often highlight key skills that both recruiters and ATS systems look for, helping you tailor your resume effectively.
Pro Tip
Make sure your resume is ready to shine in the job market by using our ATS Resume Checker. It helps you uncover more than 30 common errors, boosting your chances of smoothly passing through applicant tracking systems.
10 skills that appear on successful Tableau developer analyst resumes
To attract recruiters' attention, it's important to highlight the most sought-after skills for Tableau developer analyst positions. You can see these skills in action through resume examples, which will help you approach job applications with confidence.
By the way, consider incorporating relevant skills from the following list into your resume if they align with your experience and job requirements:
Data visualization
SQL skill
Dashboard development
Business intelligence tools knowledge
Attention to detail
Analytical thinking
Problem-solving abilities
Collaboration and teamwork
Communication skills
Adaptability
Based on analysis of 5,000+ computer software professional resumes from 2023-2024
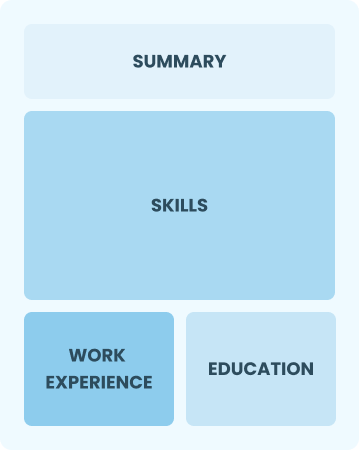
Resume Format Examples
Choosing the appropriate resume format is important for a Tableau developer analyst because it highlights key analytical skills and relevant experiences that demonstrate your ability to drive data-driven decisions.
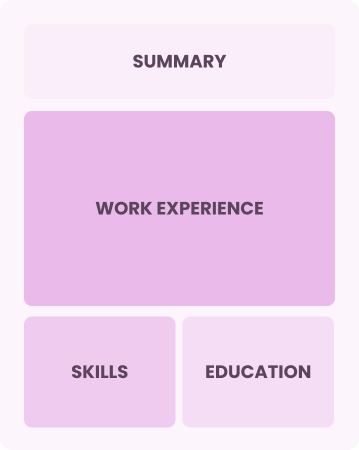
Entry-Level 0 - 2 years
Functional
Focuses on skills rather than previous jobs
Best for:
Recent graduates and career changers with up to two years of experience
Mid-Career 3 - 7 years
Combination
Balances skills and work history equally
Best for:
Mid-career professionals eager to demonstrate their skills and growth potential
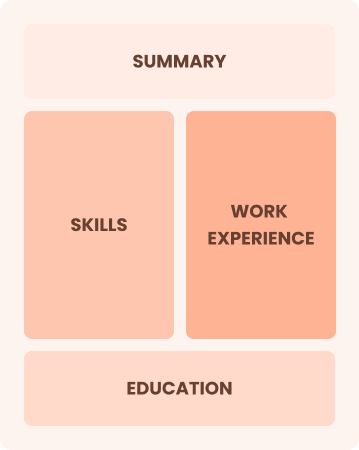
Experienced 8+ years
Chronological
Emphasizes work history in reverse order
Best for:
Seasoned analysts excelling in data visualization and strategic insights
Frequently Asked Questions
Should I include a cover letter with my Tableau developer analyst resume?
Absolutely, including a cover letter is a great way to improve your application. It allows you to showcase your personality and connect your skills with the job requirements. If you're looking for tips on crafting an effective cover letter, check out how to write a cover letter for examples and templates that can guide you through the process. You can also use our Cover Letter Generator to create one tailored specifically for your needs. Don't miss this opportunity to make a memorable first impression!
Can I use a resume if I’m applying internationally, or do I need a CV?
When applying for jobs outside the U.S., use a CV instead of a resume as many countries favor this format. It offers a comprehensive overview of your qualifications and experiences. Explore our resources on how to write a CV and discover various CV examples to improve your application.
What soft skills are important for Tableau developer analysts?
Soft skills, including interpersonal skills, problem-solving, communication, and collaboration, are essential for a Tableau developer analyst. These abilities allow you to interpret data effectively, present insights clearly, and work seamlessly with teams to drive informed decision-making.
I’m transitioning from another field. How should I highlight my experience?
When applying for Tableau developer analyst roles, highlight your transferable skills such as analytical thinking, attention to detail, and effective communication. These abilities play a important role in data visualization and analysis. Use specific examples from your previous experiences that showcase how you effectively solved problems or improved processes, illustrating your readiness to excel in this new field.
How do I write a resume with no experience?
Crafting a resume with no experience for a Tableau Developer Analyst role is achievable. Highlight your analytical skills, relevant coursework, personal projects, and any certifications in data visualization tools. Emphasize your ability to learn quickly and adapt. Remember, employers value enthusiasm and potential just as much as experience.
How do I add my resume to LinkedIn?
To improve your professional visibility, you should add your resume to LinkedIn. Consider uploading it directly or highlighting key achievements in the "About" and "Experience" sections. This strategy helps recruiters and hiring managers easily find qualified Tableau developers like you, increasing your chances of landing relevant opportunities.

Ready to land the job?
Join 28M+ others who've built a resume that works.